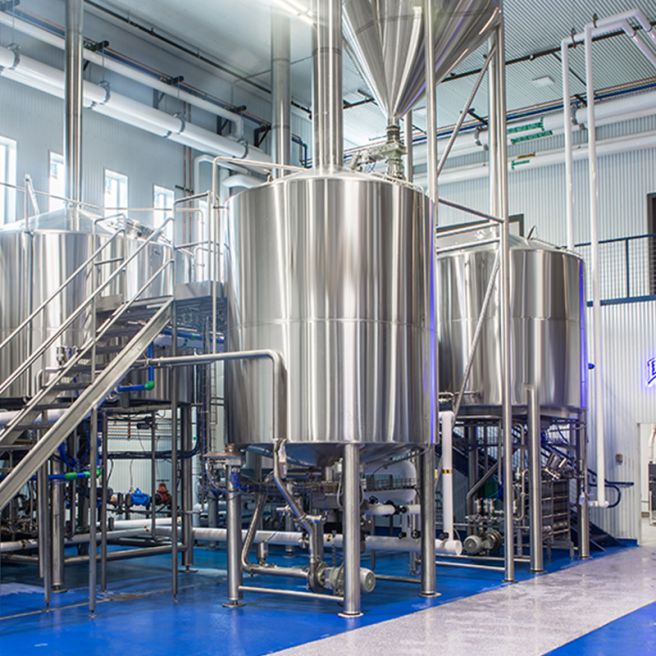
A custom brewhouse matters because brewing capacity on a specification sheet does not describe actual production performance. Two 10 BBL systems can produce very different daily output when heating rate, lauter area, vessel scheduling, grain capacity, wort transfer, and cleaning time differ. A brewery running 2–3 turns per day needs a different layout from a brewpub making 3–5 batches per week. Water use adds another measurable difference: Brewers Association guidance has reported an industry average near 7 barrels of water per barrel of beer, while efficient craft breweries can operate below 3:1. Equipment design affects cost every time a batch is brewed.
Brewhouse sizing should therefore begin with beer volume and production frequency rather than vessel diameter alone. One U.S. beer barrel is 31 gallons, so a nominal 10 BBL batch represents 310 gallons before normal process losses are considered. Brewing 10 BBL once per day and brewing the same volume three times per day place very different demands on heating, lautering, wort cooling, hot-water recovery, pumps, and cleaning. A 2026 Brewers Association resource also treats brewhouse efficiency as a measurable operating metric rather than a simple equipment specification.
A brewery planning 3,000 BBL per year has a different equipment requirement from one planning 12,000 BBL. At 10 BBL per finished batch, 3,000 BBL represents roughly 300 batches before losses and scheduling adjustments; 12,000 BBL represents about 1,200. If one small inefficiency adds only 15 minutes to every batch, 1,200 batches add about 300 production hours. Vessel configuration, valve arrangement, heating power, pump flow, and cleaning access therefore become increasingly important as annual volume rises.
A custom brewery system can match that production pattern instead of forcing a brewer to work around a standard layout. A low-frequency brewpub may operate well with a mash/lauter vessel and kettle/whirlpool combination. A brewery targeting 2 or 3 turns in an 8–12 hour production day can separate mash, lauter, kettle, and whirlpool functions so one batch moves forward while another begins.
| Production requirement | Standard sizing problem | Custom design response |
|---|---|---|
| 1 batch/day | Extra vessels may remain unused | Simpler 2-vessel layout |
| 2–3 batches/day | Vessel waiting time reduces output | 3- or 4-vessel sequencing |
| High-gravity beer | Grain capacity can limit batch size | Larger mash/lauter working volume |
| Heavy hop loads | Solids can slow transfer | Whirlpool and outlet sizing adjusted |
| Future 25–50% growth | Utilities may become undersized | Spare piping, controls, and utility capacity |
Recipe range is another reason nominal volume can be misleading. A 10 BBL pale ale does not place the same demand on a mash vessel as a 10 BBL imperial stout. Higher original gravity normally requires more malt per finished barrel, increasing mash volume and grain-bed depth. A system sized around moderate-strength beer may reach its grain limit before its liquid-volume limit. A brewery producing 6% ABV ales most weeks but regularly brewing 9–12% ABV specialty beer should therefore size mash and lautering equipment around the upper part of its recipe range, not the average recipe.
Lautering performance depends on grain-bed depth, vessel diameter, false-bottom area, rake geometry, runoff rate, and sparge distribution. Increasing vessel volume without checking these relationships can increase capacity on paper while extending actual runoff time.
Extract performance makes the financial effect easier to measure. In February 2026, the Brewers Association reported that a 10% increase in extract efficiency could produce a similar reduction in malt requirement; for one example seven-barrel batch, the difference could equal one 50-pound bag of malt. Over 400 annual batches, even one bag per brew represents about 20,000 pounds of malt.
That result depends partly on process design. Stable mash temperatures, suitable liquor-to-grist ratios, controlled runoff, correct sparging, pump speed, and repeatable water measurement all influence how much available extract reaches the kettle. Temperature probes positioned in poorly mixed areas can give readings that do not represent the entire mash. A variable-frequency pump and controlled wort collection can give the brewer more control than a fixed-speed pump and manual throttling, particularly when recipes change from one week to another.
Heating capacity deserves the same calculation. Raising hundreds of gallons of wort from mash-off temperature to boiling requires substantial thermal energy. A system that reaches the next stage 20 minutes slower than expected may appear acceptable during one brew, but two daily batches can add more than 3 hours of delay across a 5-day production week when heating and vessel waiting times accumulate. Steam-jacket area, boiler output, electric-element capacity, heat losses, and batch volume should therefore be assessed together.
Steam systems are common in commercial breweries because heat can be distributed through vessel jackets and controlled over a broad production range. Electric systems can suit smaller facilities or buildings without steam infrastructure. Direct-fire equipment has different installation and heat-transfer requirements. No single method fits every 5, 10, 20, or 30 BBL brewhouse; local utility availability and desired heating rate matter more than the heating label by itself.
Water use shows why utility planning cannot be separated from brewhouse design. Brewers Association guidance has placed average brewery water use around 7:1, or seven barrels of water for each barrel of beer, while some craft producers operate below 3:1. An older Brewers Association resource also notes that breweries without successful conservation programs may exceed 10 gallons of water for every gallon of beer produced.
For a brewery producing 10,000 BBL annually, moving from a 7:1 to a 4:1 water-use ratio represents 30,000 fewer barrels of incoming water, equal to about 930,000 U.S. gallons. Not every reduction comes from the brewhouse, but hot-liquor sizing, wort-cooling recovery, CIP design, hose practices, tank cleaning, and process piping all influence the total. The Brewers Association continues to publish water and wastewater guidance in 2026 because both incoming water and sewer charges remain material brewery expenses.
Cleaning layout also changes labor use. A brewer who manually moves hoses between six transfer points may make dozens of connections during a multi-batch day. Fixed sanitary piping, suitable valve manifolds, correctly positioned CIP connections, sloped lines, accessible pumps, and appropriate spray devices can reduce handling without making the process harder to inspect. If improved layout saves 30 minutes on 250 production days, the annual difference is 125 labor hours.
Customization should still remain proportional to brewery size. Automation that makes sense at 20,000 BBL per year may not repay its cost at 800 BBL. Brewers Association benchmarking separates facilities into production bands below 1,000 BBL, 1,000–10,000 BBL, 10,000–100,000 BBL, and above 100,000 BBL because resource use per barrel changes substantially with production scale. Its five-year benchmarking work also compares the top 25%, middle 50%, and bottom 25% of facilities for measures such as water and electricity use.
Automation is most useful when it removes a repeated operation: measuring strike water, controlling temperature, adjusting pump speed, sequencing transfers, or recording process data. Adding automated valves to a step performed twice a month has a different economic effect from automating a step performed 10 times per brewing day.
Building dimensions create another set of constraints. A 15 BBL vessel designed for a tall production building may not fit below a 12-foot ceiling, while reducing vessel height can require a larger diameter and more floor area. Door width, column position, floor loading, drainage slope, platform height, stair access, ventilation, boiler location, electrical service, and glycol piping should be checked before fabrication. A vessel that physically fits the room can still be difficult to service if a motor, manway, valve, or heat exchanger cannot be reached safely.
Cellar capacity should be checked at the same time. A 10 BBL brewhouse feeding 20 BBL fermenters may require two turns to fill one tank. If each turn takes 5 hours, the filling window becomes roughly 10 hours before cleaning and unexpected delays. Moving to a 15 BBL brewhouse does not automatically solve the mismatch because a 20 BBL fermenter still needs a fill strategy. Batch size, turns per day, fermenter volume, fermentation time, bright-tank availability, and packaging days need to fit the same production schedule.
Future capacity is easier to prepare during initial fabrication than after a brewery is operating. A brewery expecting 30–50% growth does not always need oversized vessels on day one, but additional valve ports, spare PLC capacity, larger utility headers, available platform space, and room for another kettle or whirlpool can reduce later reconstruction. Brewers Association data show why scale deserves attention: U.S. craft brewery counts reached 9,796 in 2024 and 9,578 in 2025, while operating conditions differ greatly between small brewpubs, taprooms, microbreweries, and regional producers.
Equipment selection therefore works best when the manufacturer receives actual operating numbers: target barrels per year, expected brews per day, maximum grain weight, highest original gravity, hop quantities, heating utilities, available electrical service, hot- and cold-water demand, cellar tank sizes, floor dimensions, ceiling height, and expected staffing. A 10 BBL label describes vessel capacity; it does not describe how efficiently a brewery can produce 1,000 batches through it. A custom brewhouse is useful when its dimensions, utilities, controls, and workflow are built around those measurable production requirements rather than a generic equipment list.